VisualVM is tool for profiling Java applications made by Sun. Today I would
like to write about my experience with it.
Some time ago I was experimenting with game programming in Java. I wrote
clone of famous Boulder Dash game. When playing the game on different machines
I found out that it eats terrible amount of CPU time. What? The original was
running nicely on 8bits ZX Spectrum ;). I started looking into the code and
optimize it. Some hours later the performance got better but still not good
enough. I came to the point where I could
not proceed any further. All my algorithms looked nice and clean. I delayed the
solution and left it as it was.
Recently I have heard about VisualVM and I decided to give it a try.
Making it run
Installation was smooth. I just downloaded the zip archive from https://visualvm.dev.java.net/,
extracted it and run. The first run of VisualVM resulted into warning message:
Local Applications Cannot Be Detected. But the issue is nicely documented
directly on VisualVM site and the solution took me only few seconds (see https://visualvm.dev.java.net/…hooting.html#…
for details).
Finding a big spender
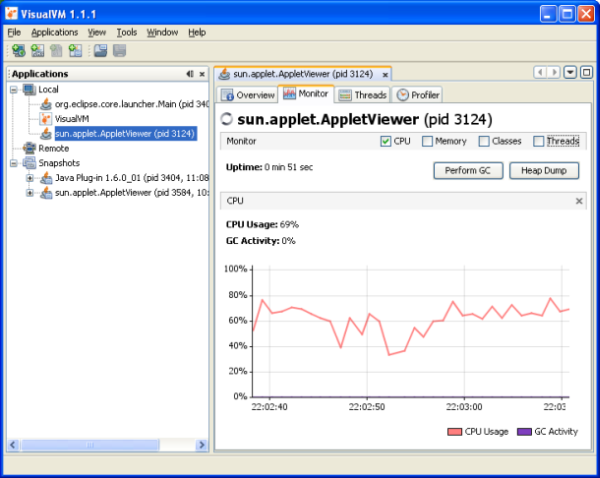
After I started-up the game i was able to see it as local java application
in VisualVM applications panel to the left:
As you can see it is using up to 80% of my 2.4GHz Sempron which is quite a
lot. I was going to find out what is eating so much performance so i clicked
on Profiler tab and opened the settings by checking the checkbox to
the right:
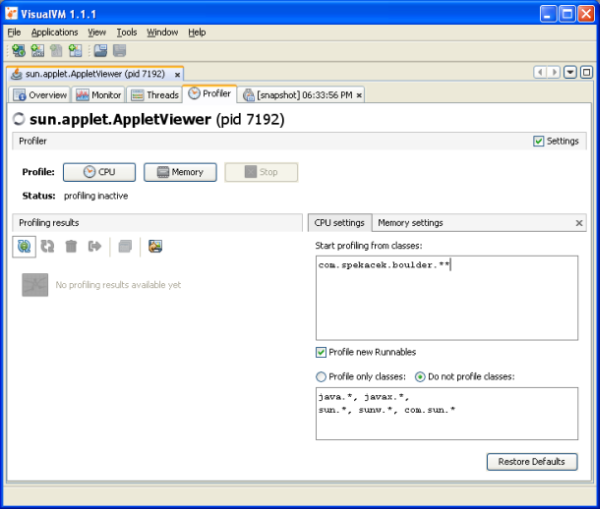
At first I left all settings as set by default except Start profiling
from classes, where I put com.spekacek.boulder.**. Then
I started up CPU profiling. Then I was playing the game for few moments –
profiling slows everything down so it was not a big fun. Then I hit
Snapshot button and I got following report:
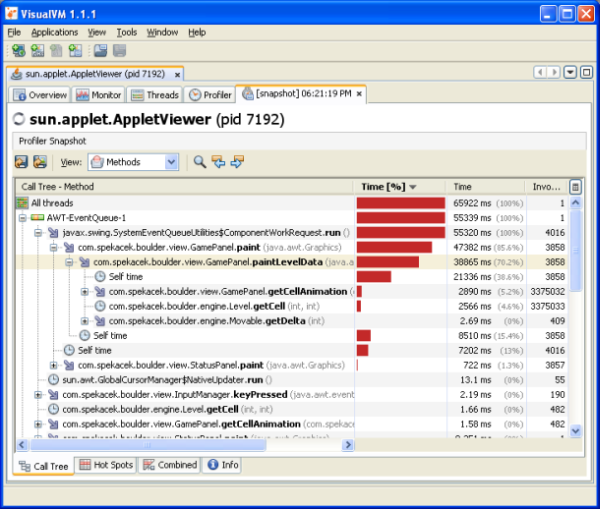
In CPU snapshot view you can see how much time did it take to process each
method. In the case of my game the obvious winner is
GamePanel.paintLevelData() method. It was called 3858 times and
sum of the times spent calling it is 38865 miliseconds which is 70.2% of time
in AWT-EventQueue-1 thread. Look at Self time item
right beneath GamePanel.paintLevelData(). This is time spend
calling not instrumented methods – methods which don't match with the
settings we did before starting the profiling.
To be able to look more deeply into what is going on in
GamePanel.paintLevelData() I started-up new profiling session.
this time I set Start profiling from classes to
com.spekacek.boulder.view.GamePanel and cleared everything in
Do not profile classes setting – I want to profile everything
starting from com.spekacek.boulder.view.GamePanel and I don't want
any exclusions. Then I started-up the CPU profiling again and after a while of
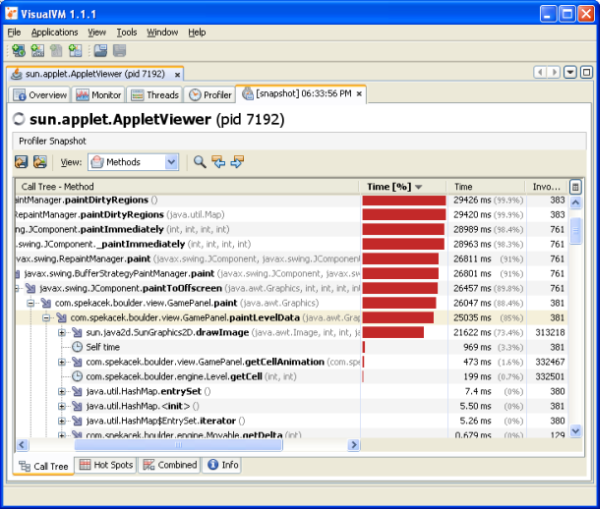
playing the game I made another snapshot. This is what I got:
Now you can see that inside GamePanel.paintLevelData() method
the biggest spender is SunGraphics2D.drawImage() method. It was
called 313218 times and sum of the times spent calling it is
21622 miliseconds.
So now I know where the problem lies and I can focus myself on fixing it.
I know that I have to paint game levels faster. I can try either to reduce
number of SunGraphics2D.drawImage() calls or find a faster
alternative. But this is not the topic of this article.
Conclusion
I like this tool. It is very simple an intuitive – not very different
from highly advanced JProfiler. It can do much more than I described in this
humble article including memory profiling, heap viewer, etc. In short it can
help you to find weak spots in your application for free. Good job guys! :)
Some links
Jan Šmuk Performance